Table of Contents
Hydrology (Stream Network)
The starting point for hydrology is a hydrologically sound DEM. Use a fill sinks or channel deepening algorithm.
There are many different ways of proceeding from here. A couple are outlined below. I originally used Approach 1, but Approach 2 seems to be an improvement.
Approach 1 - Catchment Areas tool
Catchment Areas
Create Catchment Areas. There is a Catchment Area tool (in fact several), and six methods within the tool. For the purpose of delineating watercourses in steep terrain, the choice of method probably makes little difference.
- SAGA : Terrain Analysis - Hydrology : Catchment Area
This gives an output that is best viewed in log scale. You can do this via
- Raster → Raster Calculator…
- log10 ( “Filled DEM@1” )
Use the log scale version to determine the cutoff for what streams you want to see and which ones are too small. 10000 seems to give comparable results to the existing 1:25000 maps.
Note that if you don't have the entirety of the catchment, you may get erroneous results.
Channel Network
The following tool can be used to create channels (streams) - there are other options:
- SAGA : Terrain Analysis - Channels : Channel Network
Use
- Elevation = Filled DEM
- Initiation Grid = Catchment Area
- Initiation Type = Greater Than
- Initiation Threshold = 10000 (or whatever number you have determined)

Classification
For 1:25000 maps, I've had reasonable results from using the following formula in the Raster Calculator to classify the streams into categories. Different scales may need different bounds, and this doesn't account for significantly larger rivers.
( log10 ( “Catchment Area@1” ) >= x) * ( log10 ( “Catchment Area@1” ) < y) * (“Channel Network@1” != 0)
- Intermittent: 4-6.15 (x-y)
- Minor: 6.15-7.4
- Major: 7.4+
Convert to Vector and Simplify
Convert to vector using r.to.vect

The raw stream data is very jagged. Smooth using
- v.generalize
- Algorithm = Hermite (there are other options which can be used, but Hermite has the smoothed line passing through the points of the original)
- Maximal tolerance value = 20 (in m, obviously scale dependent)
Simplify using using:
- Vector geometry : Simplify
Tolerance:?
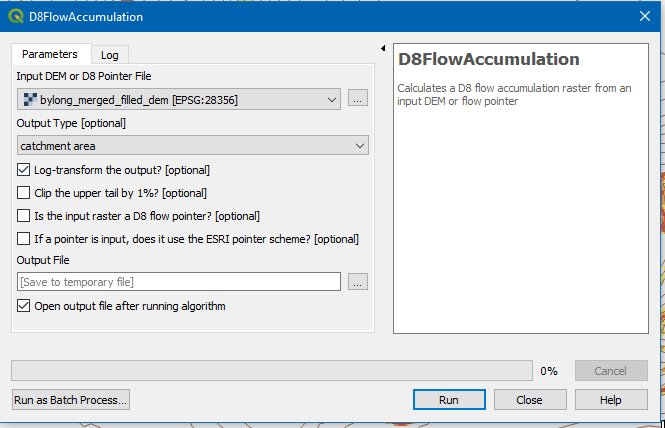
Approach 2 - D8 Flow Accumulation tool
Catchment Areas
Another approach is to install Whitebox Tools, and the associated QGIS plugin, and use the D8FlowAccumulation algorithm. If you take the log option, that can also feed into the next stage.
Channel Network
Similar technique to approach 1. The following tool can be used to create channels (streams) - there are other options:
- SAGA : Terrain Analysis - Channels : Channel Network
Use
- Elevation = Filled DEM
- Initiation Grid = Catchment Area
- Initiation Type = Greater Than
- Initiation Threshold = 5 (or whatever number you have determined)
Classification
The Channel Network produces both a raster and a vector version of the streams.
Rather than trying to classify the raster stream layer, this approach classifies the vector layer directly from the underlying D8FlowAccumulation raster.
Open Attribute Table (F6), enable editing (Ctrl+E) and Open Field Calculator (Ctrl+I).
The following formula looks at the values in the underlying D8FlowLog layer at the start and end of each line and takes the smallest, which is a reasonable approximation for stream size. The field type should be int, and the name can be whatever you want (I use Category). Note that you'd need to replace D8FlowLog in the formula below with your relevant layer id.
ceil(min(raster_value( 'D8FlowLog',1,make_point( $x_at(0),$y_at(0))),raster_value( 'D8FlowLog',1,make_point( $x_at(-1),$y_at(-1)))))-5